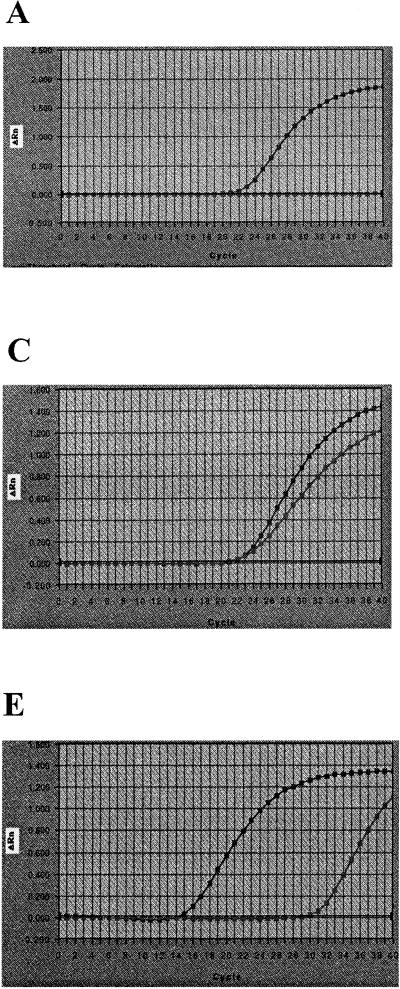
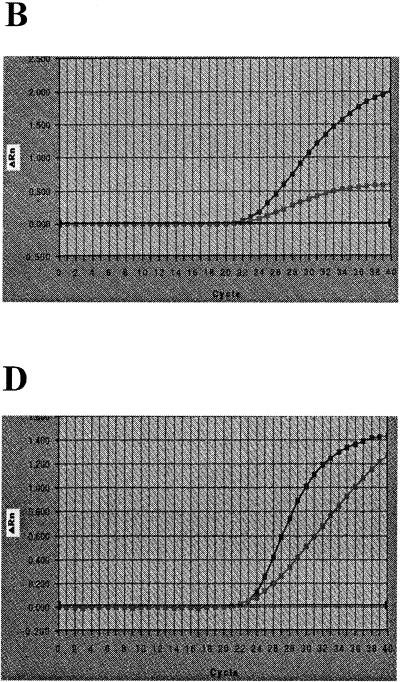
FIG. 1.
Graphical illustration of Salmonella DNA amplification kinetics of the 5′ nuclease PCR assay (13) for the low and high axial levels used in the factorial design experiment. In all five graphs (A to E) the highest final ΔRn was obtained for the high axial concentrations of each PCR reagent. All PCR reagents except the PCR reagent being studied are at the concentration of the center level (Table 1). (A) High (4.7 mM) and low (0.1 mM) MgCl2 concentrations; (B) high (160 nM) and low (40 nM) probe concentrations; (C) high (1,600 nM) and low (185 nM) primer (both forward and reverse primers) concentrations; (D) high (0.10 U/μl) and low (0.02 U/μl) AmpliTaq Gold concentrations; (E) high (2 × 10⁻⁶ g/microwell) and low (2 × 10⁻¹¹ g/microwell) DNA concentrations.


