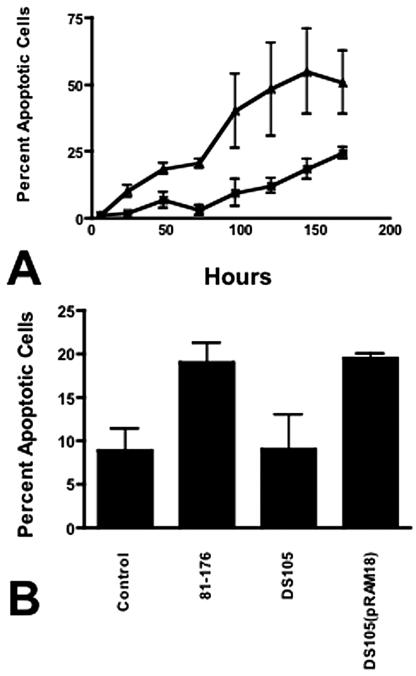
FIG. 5.
Programmed cell death of monocytes. (A) Kinetics of induction of apoptosis. 28SC cells were inoculated with 81-176 as described in the legend to Fig. 1. At the indicated time points, tissue culture cells were harvested and assayed for annexin V binding to surface PS via the Guava Nexin assay. Control cultures consisted of 28SC cells cultured in parallel without bacteria. The values reported are the mean percentages of cultured cells exhibiting early to intermediate signs of apoptosis (annexin V+ and 7-aminoactinomycin D−) ± 1 standard deviation. ▴, 81-176-inoculated 28SC cells; ×, control uninoculated 28SC cells. The data are representative of four independent experiments. (B) Induction of apoptosis by Campylobacter CDT. 28SC monocyte cultures were inoculated with 2 μg membrane protein fractions from 81-176, DS105, or DS105(pRAM18) per ml tissue culture. Control wells were incubated in parallel without inoculum or stimulation. At 48 h, the eukaryotic cells were harvested and assessed for PCD through surface PS expression and annexin V binding. The data are presented as mean percentages of cells expressing surface PS plus 1 standard deviation. P values were calculated assuming unequal variance. Statistical conclusions were verified through nonparametric Wilcoxon ranked sum tests.

