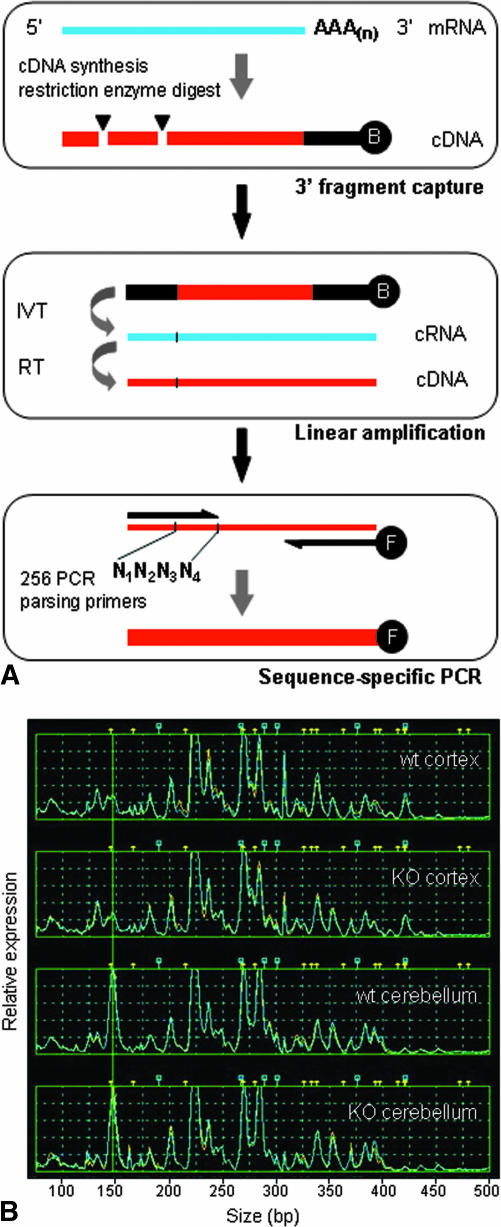
FIG. 2.
A: The TOGA method. RNA from a biological sample serves as template for cDNA synthesis initiated with a biotinylated anchor primer; the cDNA is subjected to enzymatic digest by a restriction endonuclease with four-base recognition specificity (e.g., MspI CCGG) followed by fragment capture on streptavidin-coated beads (top box). In the next steps, in vitro transcription (IVT) and reverse transcription (RT) reactions (middle box) are employed for linear amplification and production of templates for PCR, respectively. PCR is performed to systematically parse the entire set of expressed RNAs and generate sequence-specific subpools for analysis (bottom box), using an array of 256 distinct 5′ primers whose 3′ termini cover all sequence possibilities across the four bases (labeled N1N2N3N4) adjacent to the restriction digest site. Fluorescently labeled PCR products are analyzed by capillary electrophoresis to measure DNA fragment size and fluorescent intensity. B: TOGA gene expression profiles. RNA samples from cerebral cortex and cerebellum of wild-type (wt) and ATM knockout mice (KO) were analyzed by TOGA, and data are shown for one of the 256 PCRs comprising the data set. Gene expression levels are indicated along the y-axis (relative fluorescence units) and size of PCR fragments are plotted along the x-axis in base pairs. Peaks represent individual mRNAs and are assigned a unique digital address based on sequence characteristics.53 The addressing feature allows a database to be established for all detected RNAs and enables prediction of corresponding gene sequences contained in genomic databases.

