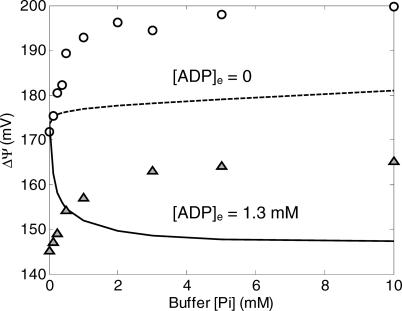
Figure 3. Comparison of Model Simulations to Experimental Data on Membrane Potential for Model without Phosphate Control.
The model without phosphate control is not able to fit the experimental data on mitochondrial membrane potential. Computed results in this figure correspond to steady-state simulations of the model described under “Mitochondrial Model without Phosphate Control.” Model simulations for [ADP]e = 1.3 mM, and [ADP]e = 0 mM are plotted as solid lines and dashed lines, respectively. Experimental data (circles and triangles) are obtained from [10].

