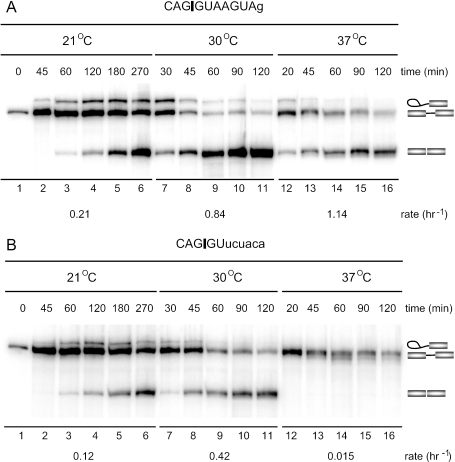
Figure 3.
In vitro splicing efficiency of pre-mRNAs with hyper- and hypostabilized interaction with U1 snRNA. Representative reaction profiles are shown for pre-mRNAs with an extended U1 snRNA interaction potential (A) and a pre-mRNA with a low U1 snRNA interaction potential (B). Each time course was used to determine observed rates of splicing at each temperature tested. The average rate of splicing is shown below each time course. Rate determinations were repeated at least three times. The nucleotide sequence above each autoradiogram represents the 5′ splice site sequences of the test pre-mRNA. Capital letters symbolize base pairing with U1 snRNA; small letters symbolize mismatched nucleotides with U1 snRNA. The vertical line (|) indicates the intron/exon junction. The identities of spliced and unspliced RNAs are indicated on the right.

