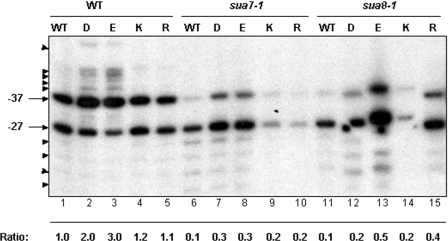
Figure 4.
Primer extension analysis of ADH1 transcription start sites. All strains (Table 1) are identical to those defined in Figure 3. In the wild-type strain (lane 1), transcription initiates at two sites, −37 and −27 (A of ATG is denoted +1), indicated by the arrows. Start sites that are enhanced in the mutant and suppressor strains upstream of −37 and downstream of −27 are highlighted by arrow heads. The ratio indicates the amount of transcript at −37 relative to −27. Quantification was performed using software from the Alpha Imager (Alpha Innotech). All values were normalized to the −37:−27 ratio for the WT strain, which was defined as 1.0.

