
Fig. 4. Isoce is inactivated in eggs.
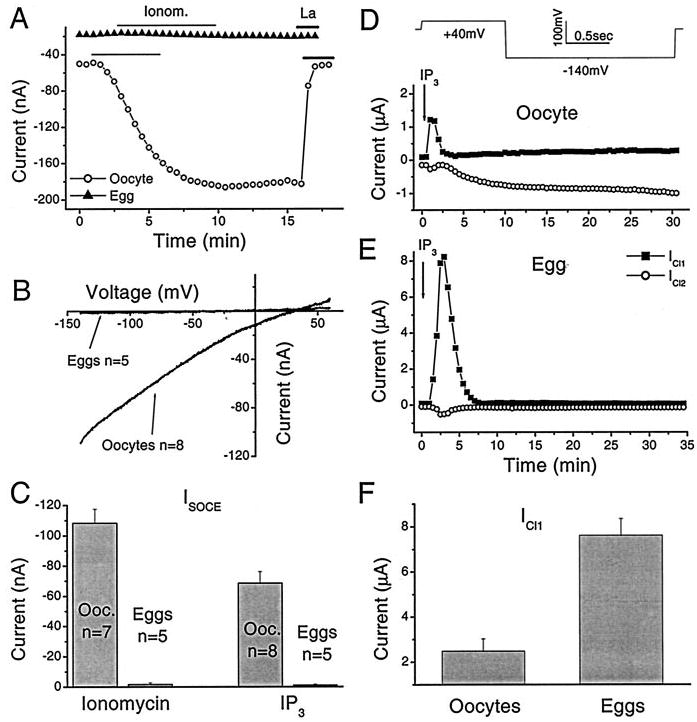
A, the same protocol outlined in the legend of Fig. 2 was used to record Isoce. Time course of Isoce activation in oocytes (circles) and eggs (triangles) in response to ionomycin (10 μm) is shown. The bars above the traces indicate ionomycin (Ionom.) and La3+ (La) addition (0.1 mm). Data show the current at −140 mV. B, current-voltage relationship of Isoce in oocytes and eggs. C, average Isoce at −140 mV in oocytes and eggs following store depletion with ionomycin or IP3. The number of cells per treatment is indicated. ICl, Ca in oocytes and eggs is as follows: cells were voltage clamped using the protocol shown in D. IP3 injection (2 pmol) is indicated by the arrow. D and E, time course of ICl, Ca development. ICl1 (squares) was measured as the maximal current at +40 mV, and ICl2 was measured as the maximal current at −140 mV as described previously (20). F, ICl1 was significantly larger (p < 0.00052) in eggs as compared with oocytes (n = 5).