Figure 2.

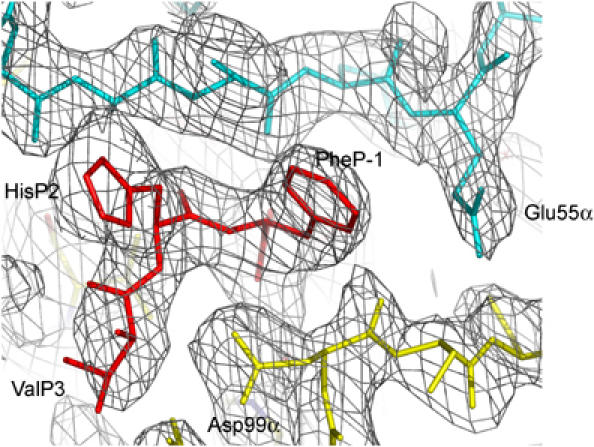
Electron density in the interface of the 3A6/MBP/HLA-DR2a complex. Density from the final 2Fo−Fc map at 2.8 Å resolution showing the N-terminal region of the MBP peptide. TCR is yellow, peptide is red and MHC is cyan. Contours are at 1σ.

Electron density in the interface of the 3A6/MBP/HLA-DR2a complex. Density from the final 2Fo−Fc map at 2.8 Å resolution showing the N-terminal region of the MBP peptide. TCR is yellow, peptide is red and MHC is cyan. Contours are at 1σ.