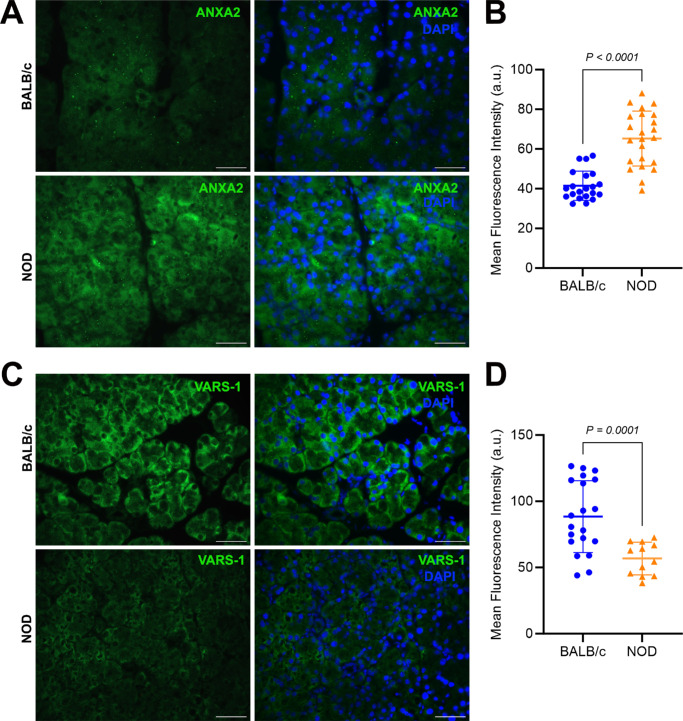
Figure 7.
Immunohistochemical confirmation of additional selected differentially expressed proteins. (A) Representative photomicrographs of annexin A2 (ANXA2) staining in BALB/c (top) versus NOD (bottom) LG tissue sections. Scale bars = 50 µm. Primary antibody was omitted for negative control sections (see Supplementary Fig. S2). (B) ANXA2 staining was statistically significantly higher in NOD samples when compared with BALB/c samples; n = 21 to 23 from 3 different mice per group. (C) Representative photomicrographs of valyl-tRNA synthetase (VARS-1) staining in BALB/c (top) versus NOD (bottom) LG tissue sections. Scale bar = 50 µm. (D) VARS-1 staining was statistically significantly lower in NOD samples when compared with BALB/c samples; n = 12 to 20 from 3 different mice per group. Data plots are presented as means ± SD.

