FIGURE 3.

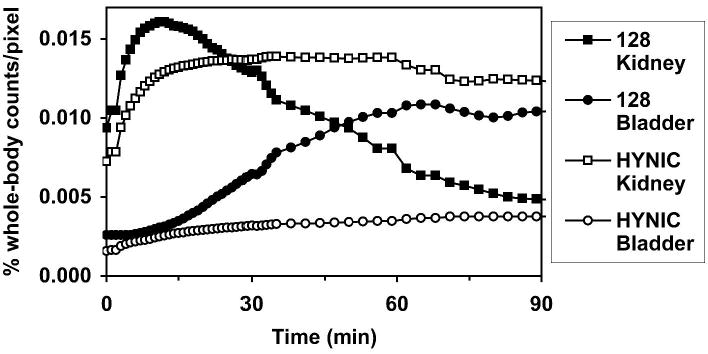
Serial dynamic imaging of kidney and bladder uptake of 99mTc-annexin V-128 and 99mTc-HYNIC-annexin V. Each curve is the mean of four animals; the coefficient of variation at each point is approximately 20%.

Serial dynamic imaging of kidney and bladder uptake of 99mTc-annexin V-128 and 99mTc-HYNIC-annexin V. Each curve is the mean of four animals; the coefficient of variation at each point is approximately 20%.