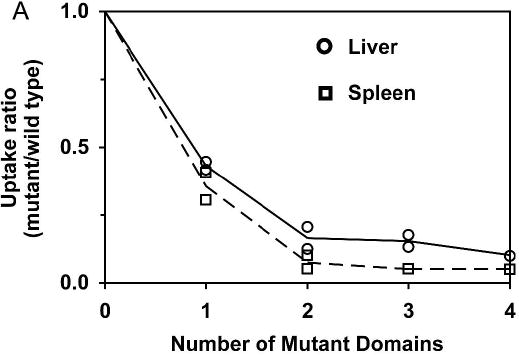
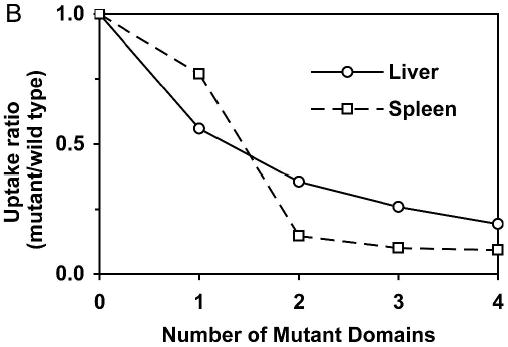
FIGURE 6.


(A) Dose-response relationship between number of affinity-reducing mutations and liver and spleen uptake in mice treated with cycloheximide. Each affinity mutant in Table 2 was tested in groups of 4–5 mice. Mean values are given for liver (○) and spleen (□) uptake, normalized to the uptake observed with wild-type protein. Mutants tested were 128 (wild-type/zero mutations); 131 and 138 (one mutation); 136 and 139 (two mutations); 137 and 143 (three mutations); 145 (four mutations). (B) Dose-response relationship between number of affinity-reducing mutations and liver and spleen uptake in normal mice.
