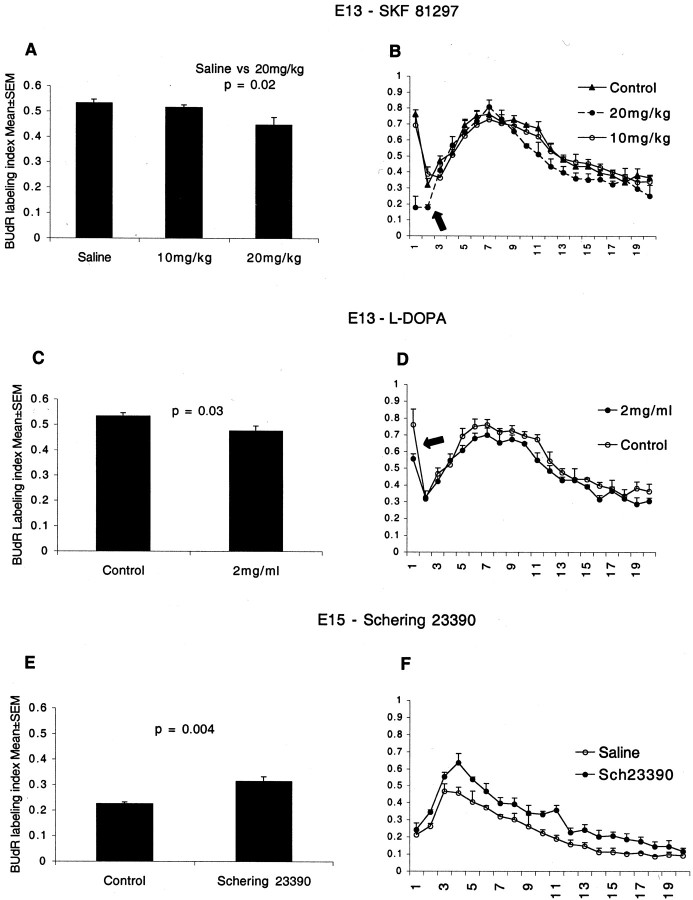
Fig. 6.
The effects of D1-like receptor agonist SKF 81297 (A, B) and l-DOPA (C, D) on BUdR LI in the LGE of E13 mice in vivo and the effects of blocking the D1-like receptors on BUdR LI in the LGE of E15 micein vivo (E, F). BUdR exposure was for 2 hr, and the LI was calculated for the entire LGE sector (A, C, E) as well as for each of 20 bins to analyze interkinetic nuclear migration (B, D, F). SKF 81297 was injected intraperitoneally into pregnant mice in two doses to produce a 6 hr exposure of the E13 embryos to the drug. Control groups received saline injections. BUdR was administered to the mother 2 hr before it was killed. SKF 81297 reduced the BUdR LI in the LGE at 20 mg/kg but had no effect at 10 mg/kg (A). The dopamine precursor, l-DOPA, and the antioxidant ascorbic acid were administered to pregnant mice in drinking water from E10 to E13. Control groups received ascorbic acid only. BUdR was administered to the mothers 2 hr before they were killed. l-DOPA also reduced the BUdR LI in the LGE (C). Thus, as in the explants, D1-agonist and dopamine reduced the BUdR LI. The D1-like receptor antagonist Schering 23390 was injected into the forebrain ventricles of E15 mice in utero. Two hours later, BUdR was administered to the mother carrying the injected embryos. The mice were killed 2 hr after the BUdR administration. Schering 23390 increased the BUdR LI (E). The increase in the LI indicates that augmenting D2-like receptor activation by endogenous dopamine as a result of blocking the endogenous D1-like receptors promoted G1- to S-phase entry. The BUdR LI is lower at E15 (E) than at E13 (A, C) because of the normal developmental decline in cell proliferation. The distribution of BUdR LI in the 20 bins in the drug-administered groups was similar to that in the control groups in all three experiments (Fig.6B,D,F). Therefore, the interkinetic nuclear migration was preserved after the drug administration, indicating that there was no gross perturbation of cell cycle progression. The marked rise in the LI in bin 1 in the E13 plots (B, D, arrows) is not evident in the E15 plots (F). The size of the SVZ increases significantly from E13 to E15. The SVZ progenitors do not migrate to the ventricular border (bin 1) for M-phase. Therefore, there is a lower increase in the BUdR LI in that region on E15 compared with E13.

