
Figure 1.
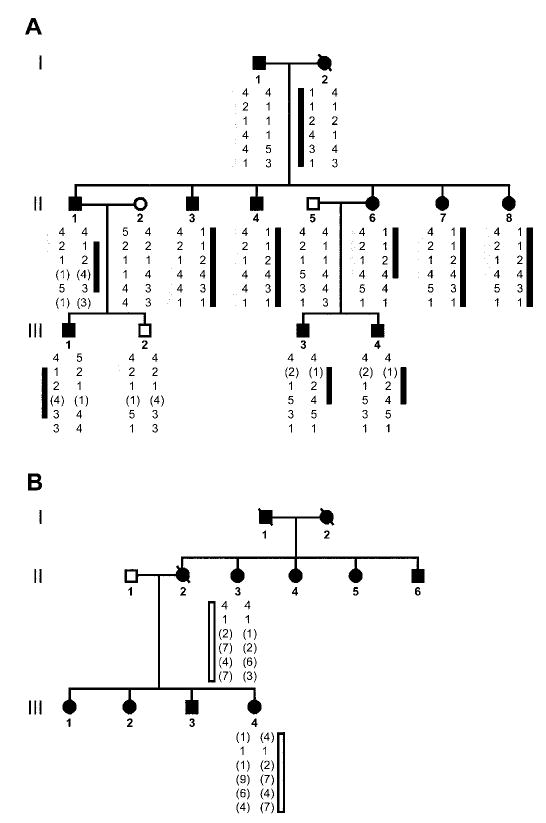
Fine mapping studies in two families with essential tremor and the 828C→G mutation in the HS1-BP3 gene. Six loci including D2S2150, rs3732149, rs11680700, etm1240, etm1231, and etm1234 were used in the analysis. (A) Haplotype analysis of the first family that was identified with 828C→G mutation in the HS1-BP3 gene. The dark bar represents the affected alleles inherited from Individual I-2. Individual II-1 shows a recombination at the first locus D2S2150. Individual II-6 shows a recombination at the fifth locus etm1231. The gray bar represents the affected alleles inherited from Individual I-1. Individual II-1 shows a recombination at either the fourth (etm1240) or the fifth (etm1231) locus. No other recombinants are found telomeric to these loci on the ETM2 candidate contig.24 (B) Haplotype analysis of the second family with the 828C→G mutation in the HS1-BP3 gene. The white bar represents the alleles shared by Individuals II-3 and III-4. The extended haplotype for the six loci are different from the haplotypes in the family members shown in figure 1A. Black circles (females) and squares (males) represent affected individuals with essential tremor. Unaffected individuals are not shaded. Each generation is represented by Roman numerals to the left of the pedigrees. An individual is identified by generation number and the numbers below the symbols. The pedigree and individual identifiers in figure 1A are the same as in figure 2B. The pedigree and individual identifiers in figure 1B are the same as figure 2C.