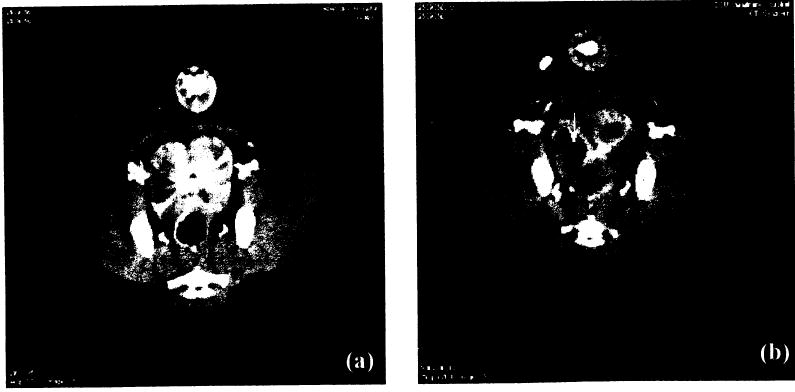
Fig. 4.

Blood perfusion CT scan, a: Pre-PDT and (b) 48 hours post-PDT, PDT protocol: 2 mg/kg, 150 mW/cm; right lobe −200 J/cm and left lobe −100 J/cm. PDT-induced necrosis is clearly visible and the lesion size correlates well with the light dose. The arrow indicates a cavitationary lesion.
