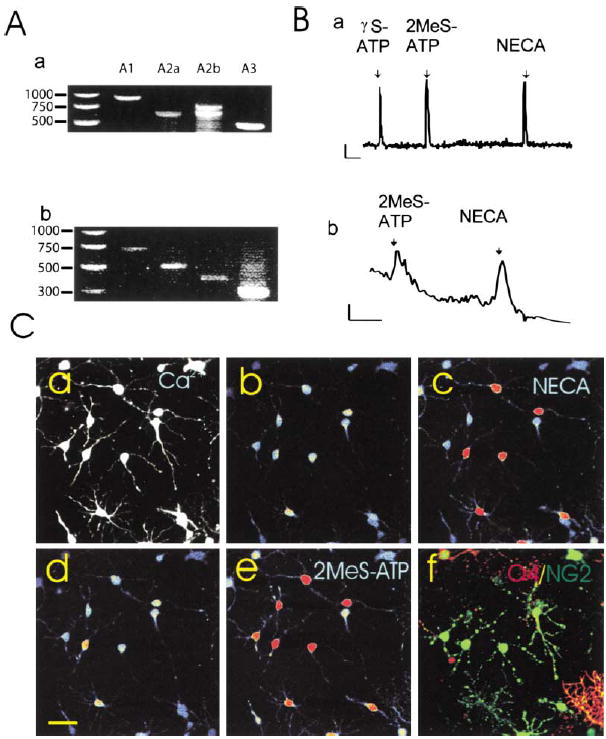
Figure 1. A Diverse Range of Purinergic Receptors Was Detected in OPCs.

(A) mRNAs for all major classes of adenosine receptors were detected by RT-PCR in rat OPCs after 2 days in culture (a) and in mouse OPCs freshly isolated by fluorescence activated cell sorting (b). Species-specific primers yielded different size products as well as double bands for rat A2b due to alternate splicing (Kreisberg et al., 1997).
(B) Functional purinergic receptors linked to Ca2+ signaling were detected by intracellular Ca2+ imaging in response to ATP receptor agonists (γS-ATP and 2MeS-ATP, 100μM) and adenosine receptor agonists (NECA, 100 μM and adenosine [data not shown]) in individual rat OPCs in culture (a) and OPCs freshly isolated from mice expressing the CNP-GFP transgene (b). Indo-1 was used to measure Ca2+ responses in acutely isolated cells to avoid fluorescence from GFP. Note: Indo-1 is less sensitive than fluo-3. Scale = 10ΔF/F/2 min.
(C) Oligodendroglial cells at both the immature NG2+ stage and more differentiated O4+ stage showed intracellular calcium responses to ATP and adenosine receptor agonists, and often responses to both receptor agonists were seen in the same cell. Cells were filled with fluo-3, a calcium-sensitive fluorescent dye (a), and responses to a specific adenosine receptor agonist (b and c) and an ATP receptor agonist (d and e) were recorded in the same cells using time-lapse confocal microscopy. (Higher concentrations of intra-cellular calcium are indicated in warmer colors.) At the completion of the calcium-imaging experiment, the identical cells were double stained with antibodies against NG2 (green) and O4 (red), and examined by confocal microscopy (f). All the cells in this field were either NG2 and/or O4+ oligodendroglial cells. Of the 17 cells in this microscope field, 11 responded to the adenosine receptor agonist NECA (100 μM), 13/17 responded to the ATP receptor agonist 2MeS-ATP (100 μM), 11/17 cells responded to both agonists, and 4/17 cells showed no measurable response to either agonist.
