
Fig. 4.
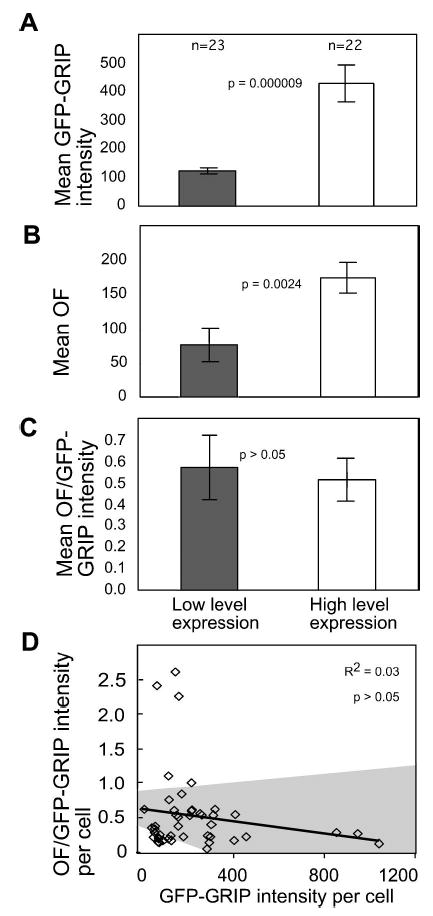
Normalization of GFP-GRIP morphometric data for differences in fusion-protein expression level. (a), (b), and (c) The morphometric data from 45 cells shown in Fig. 3 were divided into two subpopulations based on expression of low levels (gray bars) and high levels (white bars) of GFP-GRIP. The graphs display the mean values for the morphometric data representing the two cell subpopulations. The displayed p-values estimate the significance of the difference between the two subpopulations as calculated by ANOVA and post hoc t-test. Error bars denote standard error of the mean. (d) For each cell, the OF value quantifying GFP-GRIP organization was normalized for the relative level of GFP-GRIP fusion protein expression. In the plot, each square represents the normalized data from a single cell. The gray areas define the 95% confidence intervals for the best-fit line. The R2 value and the ANOVA F test p-value indicate that there is no significant correlation between the normalized morphometric data and GFP-GRIP expression level in each cell.