
Fig. 6.
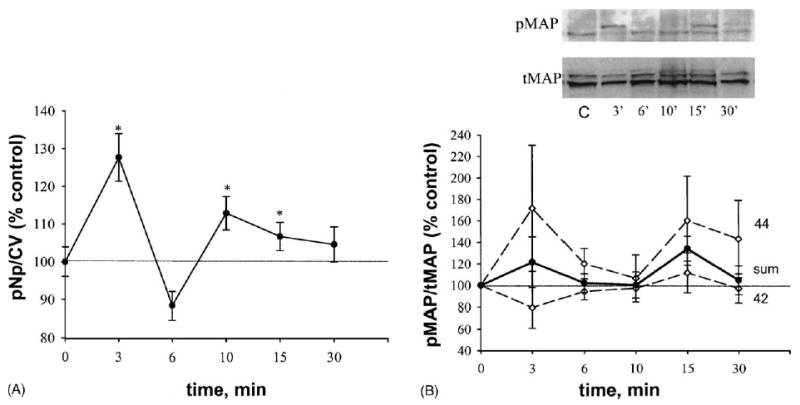
DES (1 nM) effects on ERK 1/2 phosphorylation. *: Statistical significance (P < 0.05) vs. EtOH (0.00001%) vehicle-treated controls. Data are presented as % of control values, which were set to 100%. (A) Plate assay, means ± S.E.; n = 65–79 wells from six different plates. (B) Western analysis, four experiments, each band scanned to produce a densitometry value; values presented are means ± S.E. “Sum” (solid line) indicates the average between ERK 1 (44) and ERK 2 (42) phosphorylation values. Inset is a representative Western blot where C indicates vehicle-treated control.