
FIG. 1.
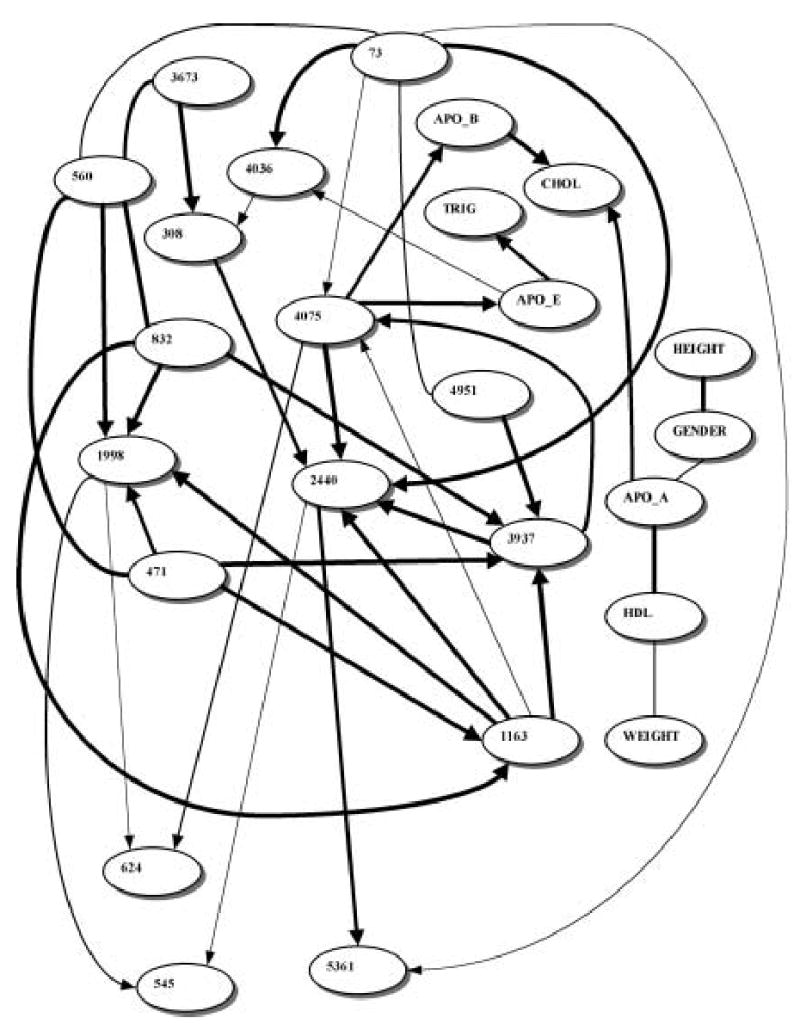
Learned Belief network relating APOE SNPs to plasma apoE levels in Jackson, MS. Node legends: numbers refer to corresponding SNPs (see Fig. 1 in Nickerson et al. [2000] for an APOE SNP map). APO_E, APO_A, APO_B, TRIG, CHOL, and HDL stand for levels of apolipoproteins E, AI and B, triglycerides, cholesterol and high-density lipoprotein cholesterol, respectively. Line thickness corresponds to the relative edge strength (see Table 1.)