
Figure 8.
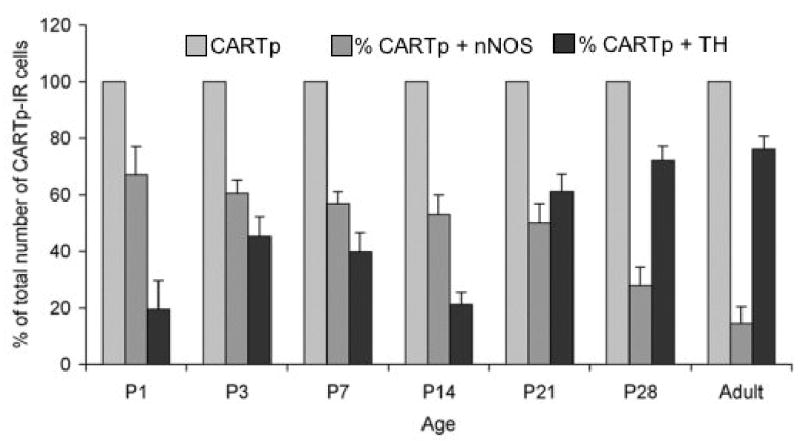
Histogram that demonstrates that the colocalization of CARTp-IR cells with neuronal nitric oxide synthase (nNOS) or tyrosine hydroxylase (TH) is dependent upon postnatal age and the patterns of colocalization show an inverse relationship. The percentage of CARTp-IR cells that also express nNOS is highest at birth and shows an age dependent reduction. Age accounted for 96% of the variability in this colocalization, p ≤ 0.005. In contrast, the percentage of CARTp-IR cells that expressed TH is lowest at birth but shows a significant increase in colocalization with age. Age accounted for 87% of the variability in this colocalization, p ≤ 0.01.