
Figure 9.
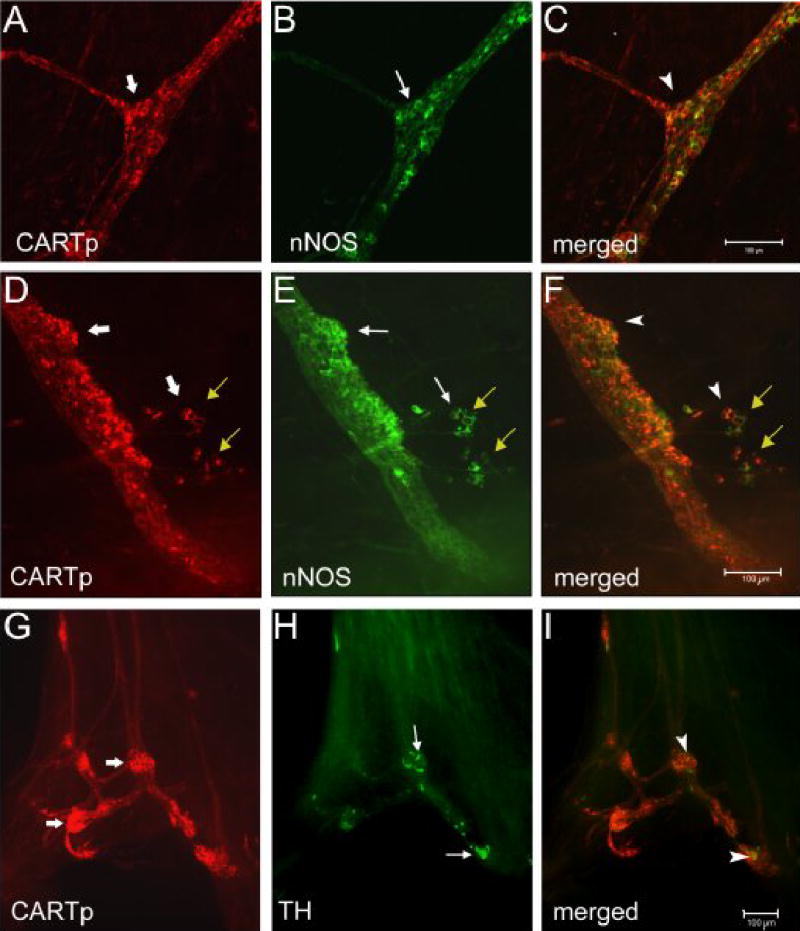
Colocalization of CARTp-IR cells with neuronal nitric oxide synthase (nNOS) or tyrosine hydroxylase (TH) is dependent upon postnatal age. At birth, the majority of CARTp-IR (A, D, wide arrows) cells also express nNOS-immunoreactivity (B, E, arrows). Merged images (C, F) where red staining represents CARTp and green represents nNOS. Cells that express both CARTp and nNOS appear yellow/orange (C, F, arrowheads. Small groups of CARTp-IR cells or individual CARTp-IR cells also appear to migrate away from the larger cell clusters (D–F, yellow arrows). These CARTp-IR cells also show some colocalization with nNOS. In contrast, few CARTp-IR (G, wide arrows) cells express TH-immunoreactivity (H, arrows) at birth. Merged image (I) where red staining represents CARTp and green represents TH. A few cells that express CARTp + TH appear yellow (I, arrowheads). Calibration bar in C represents 100 μm in A–C. Calibration bar in F represents 100 μm in D–F. Calibration bar in I represents 100 μm in G–I.