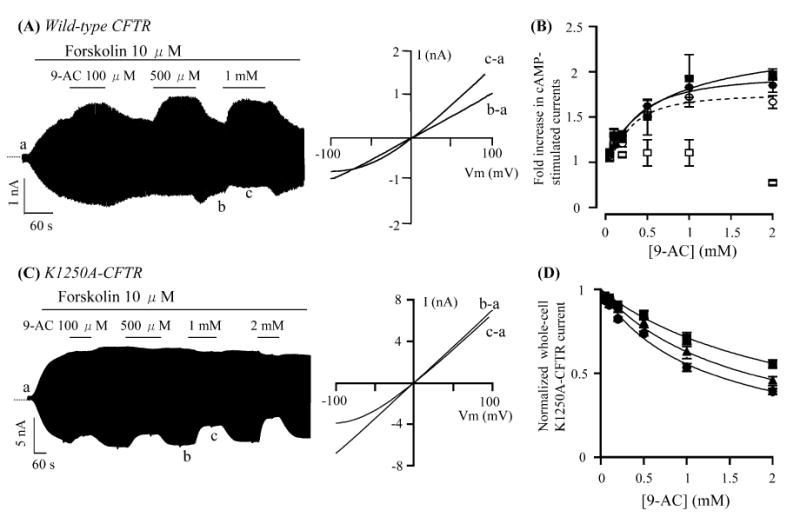
Fig. 1A–D.

Effects of anthracene-9-carboxylic acid (9-AC) on whole-cell cystic fibrosis transmembrane conductance regulator (CFTR) currents. A A whole-cell wild-type CFTR current trace in the presence of 10 μM forskolin and various concentrations of 9-AC. I-V relationships shows net CFTR currents in different conditions as marked in the left panel. B Dose-response relationships of 9-AC potentiation effects. Net potentiation effects in wild-type CFTR were calculated by correcting for the inhibitory effects obtained from recordings of 9-AC on K1250A-CFTR currents. ycomp = yraw/(1 − x/100), where ycomp, is the compensated value; yraw, the measured fold increase; x, the percentage inhibition of whole-cell K1250A-CFTR currents with 1 mM 9-AC at a pipette potential (Vp) of +100 mV or −100 mV. Open circles: yraw for 1 mM 9-AC at +100 mV; filled circles: ycomp at +100 mV; open squares: yraw at −100 mV; filled squares: ycomp at −100 mV. C A whole-cell K1250A-CFTR current trace. I-V relationships show net K1250A-CFTR currents in the presence or absence of 9-AC. D Dose-response relationships of the inhibitory effect on K1250A-CFTR currents at three different voltages. Filled squares: −60 mV; filled triangles: −80 mV; filled circles: −100 mV. All values are represented by mean±SEM (n=3). Lines were fitted using the Hill equation: y=1+(ymax − 1)/[1+(Kd/x)n] or y=1/[1+(x/Ki)n], where y is normalized current; ymax the maximal response; x the concentration of 9-AC; Kd the half-maximal concentration of potentiation; Ki the half-maximal concentration of inhibition; and n is the Hill coefficient
