
Figure 8.
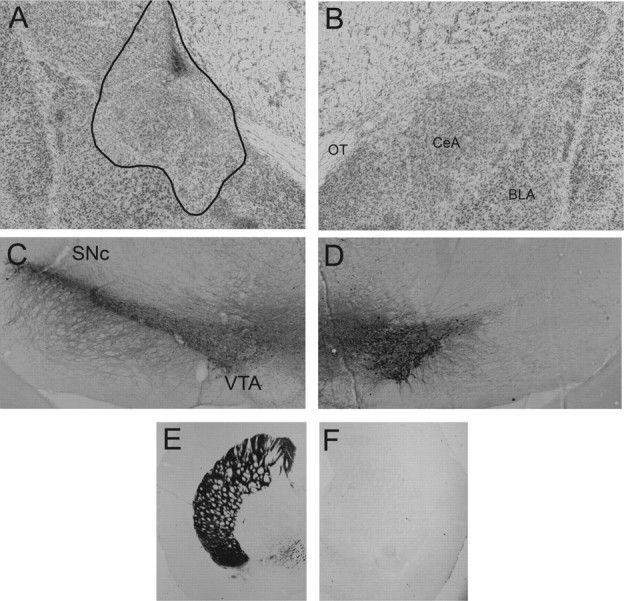
Photomicrographs illustrating the CeA and SNc lesions of a rat that received a lesion of the CeA in the left hemisphere and SNc in the right hemisphere in experiment 2. A and B show Nissl-stained sections of lesioned and intact CeAs, C and D show staining for tyrosine hydroxylase in sections of intact and lesioned SNcs, and E and F show tyrosine hydroxylase staining in the DLS targets of SNc. OT, Optic tract.