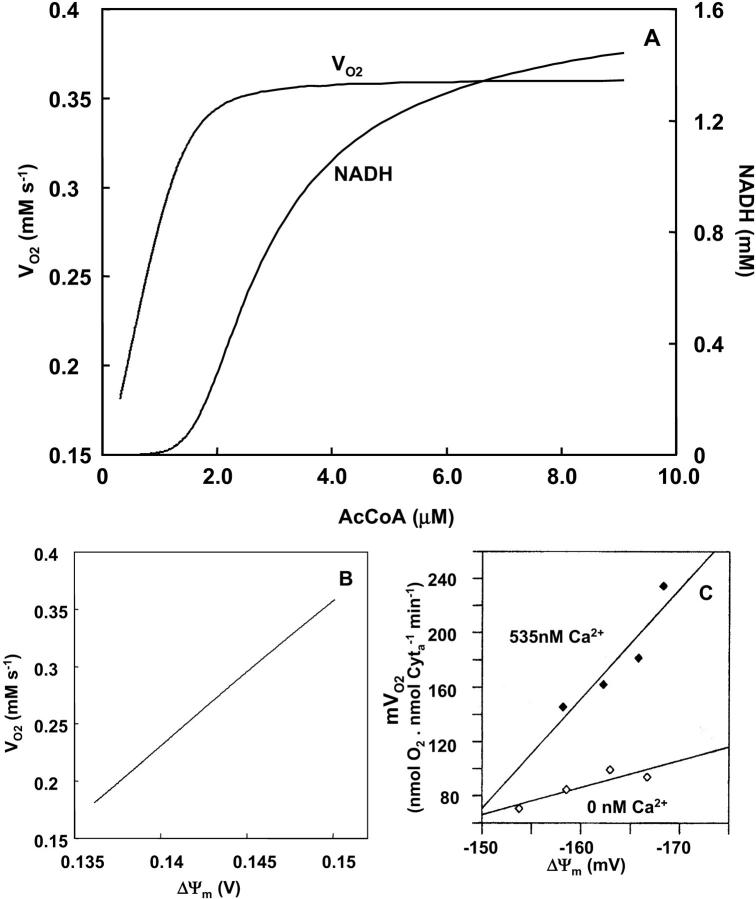
FIGURE 2.
Effects of increasing substrate delivery on mitochondrial energetics. AcCoA concentration is varied and the steady-state behavior of the model analyzed according to a continuation analysis (see text). The correlative changes in the steady-state behavior of VO2 and NADH versus (A) AcCoA and (B) ΔΨm are depicted when AcCoA is systematically changed. The simulation was run with the following set of parameters: VmaxANT = 5.0 mM s−1; ΔpH = −0.6; ρres = 0.048 mM; ADPi = 0.05 mM;  mM s−1; ρF1 = 0.06 mM; [Ca2+]i = 0.5 μM; gH = 0.01 mM s−1 V−1. The rest of the parameters are as indicated in Table 3. (C) Simulation results match experimental data obtained with pig heart mitochondria, redrawn from Territo et al. (2000).

