
FIGURE 4.
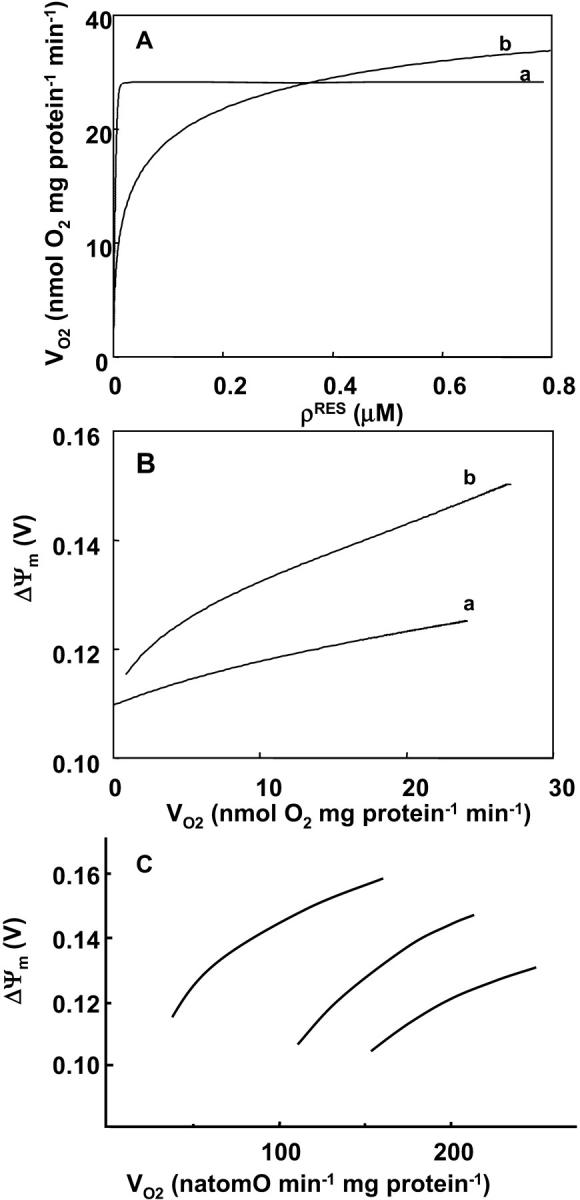
Relationship between mitochondrial inner membrane potential and the respiratory flux. The rate of the electron transport chain and the ΔΨm are modulated through the concentration of electron carriers (ρres) (A, B). A steady-state analysis of the whole model behavior is performed. The parameters utilized in the simulations are those reported in Table 3 and as follows: Pi = 20.0 mM; ΔpH = −0.6;  mM s−1; ADPi = 0.05 mM;
  mM s−1; gH = 0.01 mM s−1 V−1, [Ca2+]i = 0.1 μM and AcCoA = 1.0 mM. The values of F1F0-ATPase concentration, ρF1, differ between curves, being 1.216 mM for curve a and 0.06 mM for curve b. (C) Changes in the relationship between ΔΨm and the respiratory rate obtained upon malonate titration at different phosphorylation potentials (different ratios of creatine to creatine phosphate) in a preparation of heart mitochondria. Redrawn from Borutaite et al. (1995).