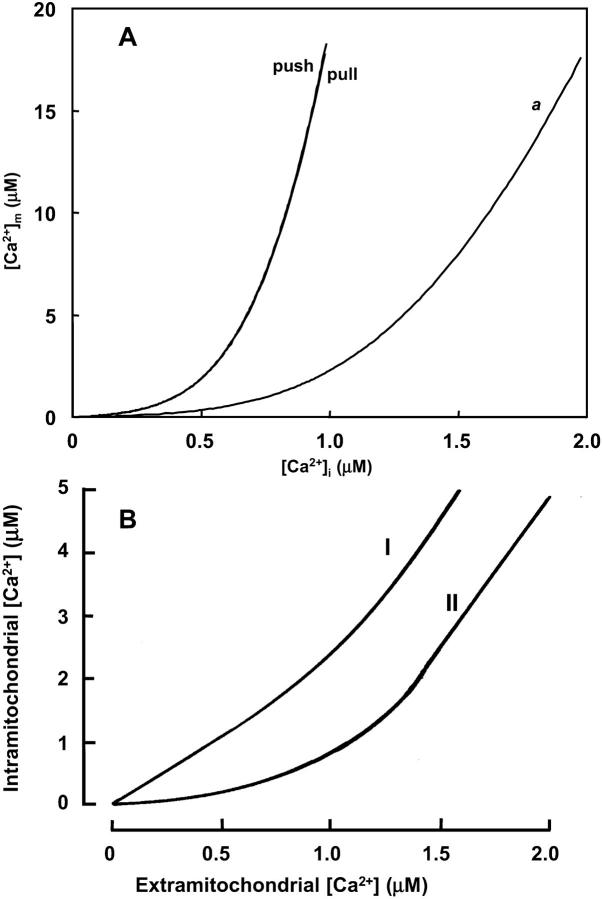
FIGURE 5.
Mitochondrial Ca2+ level after changes in cytoplasmic Ca2+. (A) The behavior of the whole model is studied with the AUTO 97 software as a function of cytoplasmic Ca2+ concentration, [Ca2+]i. The simulations were performed with the following set of parameters: (pull): ρRES = 0.00072 mM, ρF1 = 1.216 mM,  s−1,
s−1,  s−1, and
  mM s−1, and (push): ρRES = 0.0036 mM, ρF1 = 0.0522 mM,
  s−1,
s−1,  s−1, and
  mM s−1. Curve a is obtained with the same parametric set as “pull” except for
  mM s−1. Otherwise the concentration of AcCoA is 1.0 mM, and the catalytic constants of CS and MDH are
  s−1 and
  s−1, respectively. (B) Experimental results redrawn from McCormack et al. (1990) showing the accumulation of mitochondrial Ca2+ in the absence (curve I) or in the presence of Na+ (curve II).

