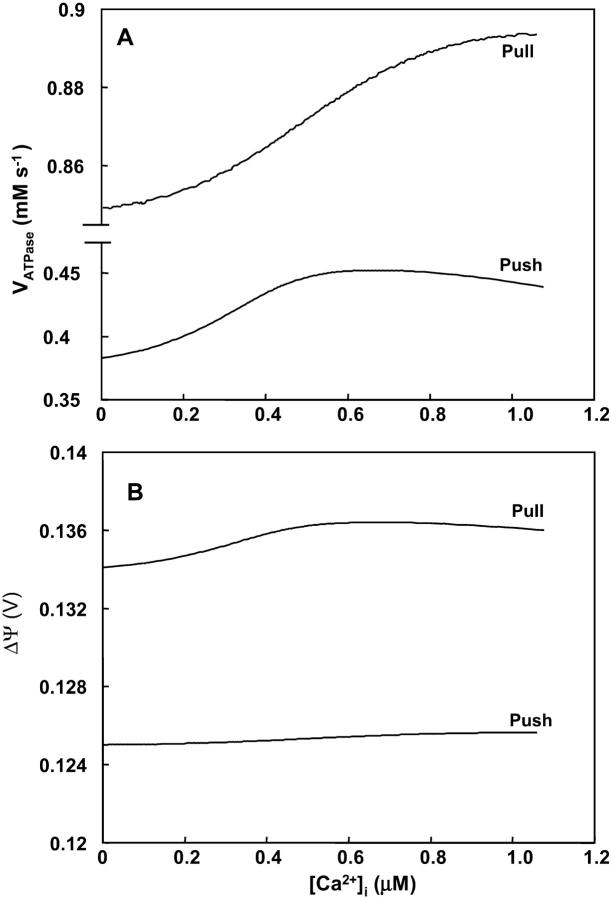
FIGURE 7.
F1F0 ATP synthase activity and membrane potential as a function of [Ca2+]i. The different curves represent the rate of the mitochondrial ATP synthase, VATPase (A) and ΔΨm (B) at steady state after an increase in [Ca2+]i, as shown in Fig. 5 with the same set of parameters described in its legend (push and pull).

