
FIGURE A1.
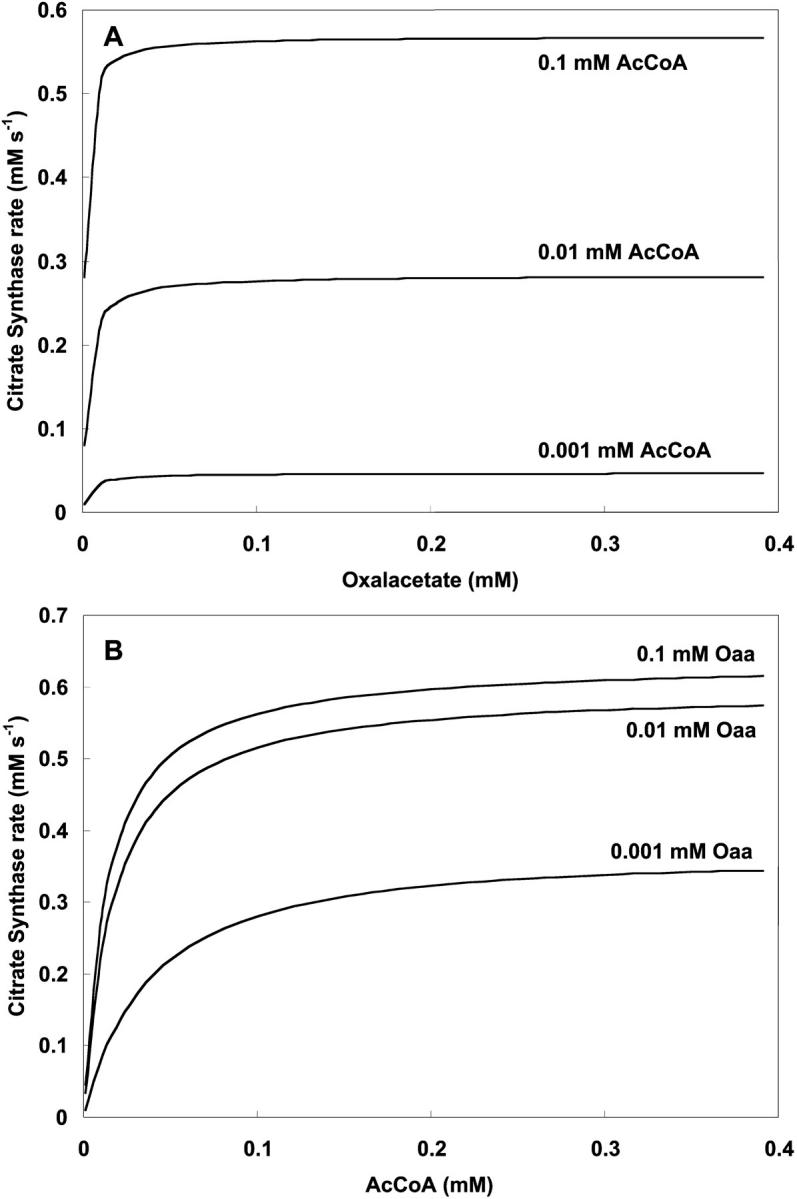
Dependence of citrate synthase activity on oxalacetate and AcCoA. (A) The rate of CS is plotted against oxaloacetate concentration with  s−1 at the specified AcCoA concentrations and parameter values according to Table 3 (see Eq. 13). (B) The same parameter set is used to study CS activity as a function of AcCoA at different oxalacetate concentrations.