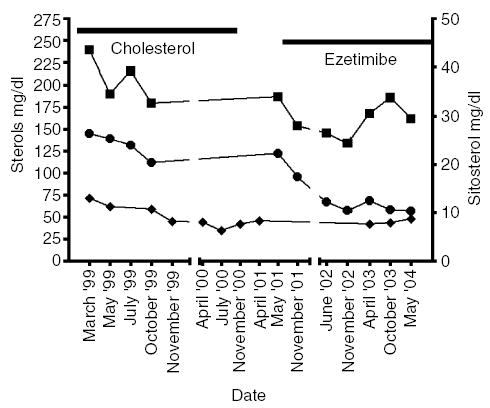
Fig. 1.

Cholesterol, plant sterol and high-density lipoprotein sterol (HDL-S) profiles on oral cholesterol and ezetimibe therapies. The cholesterol (mg/dl) (▪) and sitosterol (mg/dl) (∘) profiles, as determined by gas chromatography (GC), on samples during oral cholesterol therapy (indicated by the horizontal line) and on ezetimibe monotherapy. Because the enzymatic test was used to determine the HDL-cholesterol values (mg/dl) (♦), the term HDL-S is used. After an initial decrease, the plasma cholesterol values remained around 190 mg/dl on cholesterol tablets and 170 mg/dl on ezetimibe. In contrast, note that the plant sterol values fell on oral cholesterol therapy. The greatest and most persistent falls (more than 50%) were during therapy with ezetimibe, with lowering of sitosterol to the lowest values our patient has ever achieved (10 mg/dl).
