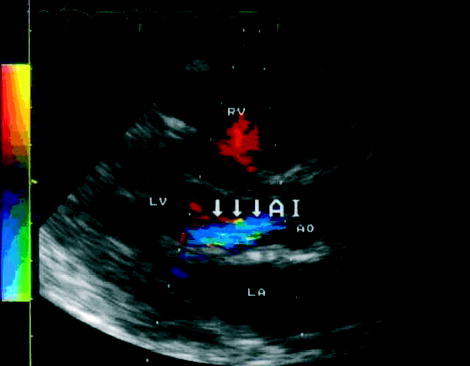
Fig. 2.

Doppler colour echocardiogram demonstrating the valvular heart disease in our patient. The left ventricle (LV), left atrium (LA), right ventricle (RV) and the aorta (Ao) are as indicated. The colour flow patterns show the aortic valve regurgitation (blue and indicated by the arrows).
