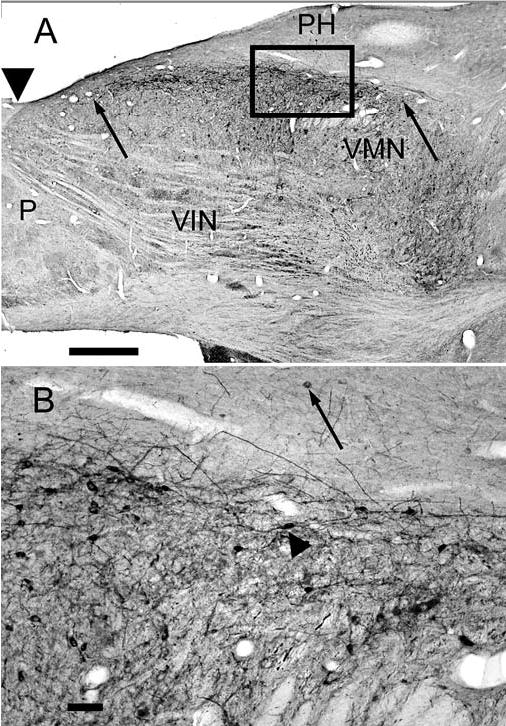
Fig. 2.

A The calretinin area in the VMN on a horizontal section at about −3.4. The anterior and posterior limits of the calretinin area are indicated by arrows. Note scattered labeled cells in the bordering nuclei VIN and PH. Arrowhead indicates an A-P level of about P14. B Higher magnification photomicrograph of the boxed area in A showing cells and processes in the calretinin area; the arrowhead points to a cell with a fusiform cell body. The arrow indicates a labeled cell in PH. Note the anterior-posterior orientation of the longer dendrites. P is posterior. Scale bars A 1 mm, B 100 μm
