Figure 3.
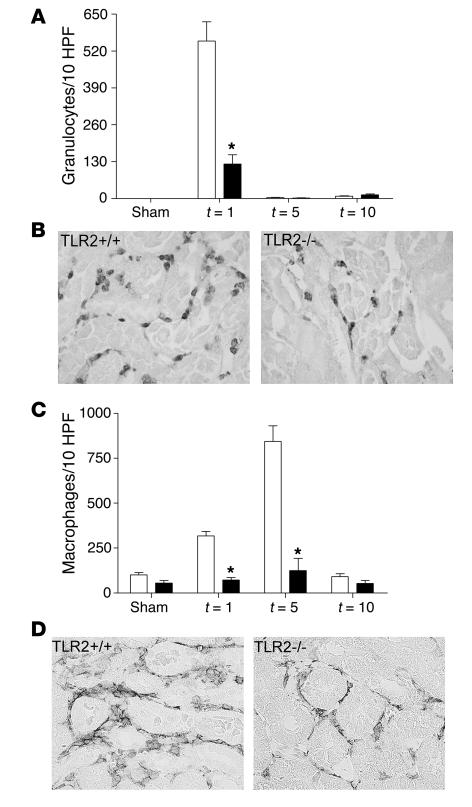
Leukocyte influx in kidneys from TLR2+/+ (white bars) and TLR2–/– (black bars) mice 1, 5, and 10 days (t = 1, 5, and 10) after renal I/R or sham operation. The number of granulocytes (A; t = 1) and macrophages (C; t = 1, 5) were significantly lower in TLR2–/– mice compared with TLR2+/+ animals after renal I/R as counted in 10 randomly selected high-power fields (HPFs) on outer medulla. Leukocytes from 8 mice per group were counted on renal tissue sections stained for Ly-6G (B; t = 1) and F4/80 (D; t = 5). Magnification, ×400. *P < 0.05.

