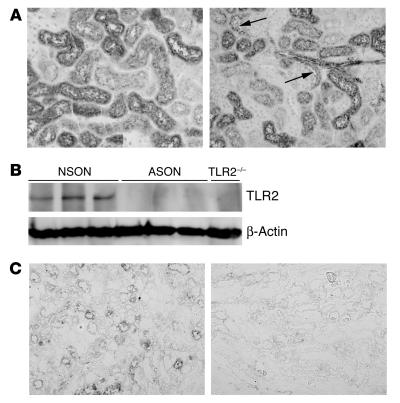
Figure 9.
Distribution and effect of ASONs in the kidneys of mice after i.p. injection of ASONs. (A) FITC-labeled ASONs were primarily targeted to the renal tubular cells (left panel) and epithelial cells from the Bowman capsule (right panel, arrows) as demonstrated by immunohistochemical analysis of FITC on renal tissue sections. Magnification, ×200. TLR2 ASON treatment reduced the amount of TLR2 protein present in kidneys from mice subjected for 1 day to renal I/R injury when compared with NSON treatment as shown by immunoblotting (B; TLR2 is detected at ∼97 kDa) and immunohistochemistry (C; left panel NSON, right panel TLR2 ASON). Magnification, ×200.

