Figure 7.
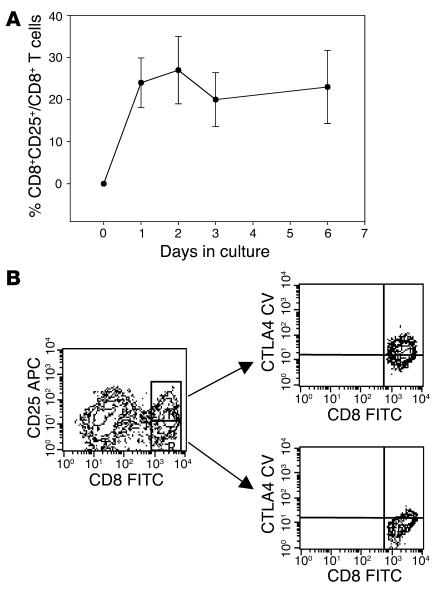
Induction of CD25+ population in CD8 cells stimulated with hOKT3γ1(Ala-Ala). (A) Freshly isolated PBMCs were cultured in the presence of hOKT3γ1(Ala-Ala) for 6 days. For analysis of CD25 expression, cells were collected on days 0 (before stimulation), 1, 2, 3, and 6 of the culture, labeled with flourochrome-conjugated anti-CD8 and anti-CD25, and analyzed by flow cytometry. The results are presented as a ratio of CD8+CD25+-expressing cells to total CD8+ cells. Mean values (± SEM) of 4 independent experiments are shown. (B) Intracellular expression of CTLA4 analyzed by flow cytometry. Left: gated CD8 lymphocytes; upper right: gated CD8+CD25+ cells; lower right: gated CD8+CD25– cells. Representative results from 3 independent experiments are shown. CTLA4CV, CTLA4 CyChrome.

