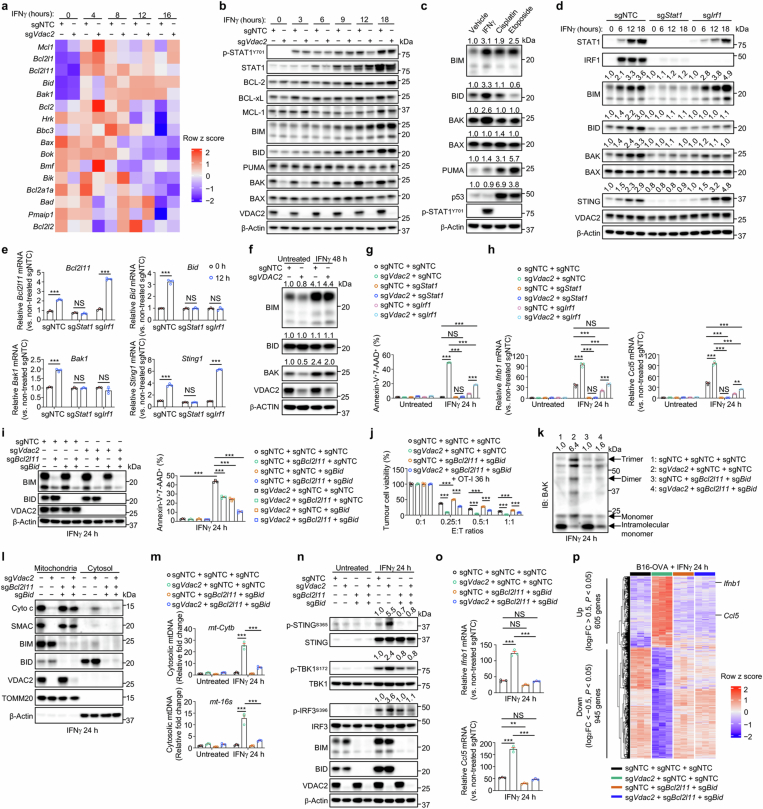
Extended Data Fig. 8. (related to Fig. 4). IFNγ-mediated coordinated upregulation of BIM, BID and BAK contributes to cell death of VDAC2-deficient cells.
a, Relative gene expression of BCL-2 family proteins in control or VDAC2-deficient B16-OVA tumour cells after treatment with IFNγ for indicated timepoints (n = 4 per group). b, Immunoblot analysis of indicated proteins in B16-OVA tumour cells after treatment with IFNγ for indicated timepoints. The same VDAC2 and β-Actin blots were shown in Fig. 3i. c, Immunoblot analysis of indicated proteins in B16-OVA tumour cells treated with vehicle, IFNγ (10 ng ml–1), cisplatin (20 μM), or etoposide (20 μM) for 12 h. Densiometric quantification of BIM, BID, BAK, BAX, PUMA, or p53 expression is shown. d, Immunoblot analysis of indicated proteins in control, STAT1-deficient or IRF1-deficient B16-OVA tumour cells treated with IFNγ for indicated timepoints. Densiometric quantification of BIM, BID, BAK and STING expression is shown. e, Relative Bcl2l11, Bid, Bak1 and Sting1 levels (versus non-treated control cells) in indicated B16-OVA tumour cells treated with or without IFNγ for 12 h (n = 3 per group). f, Immunoblot analysis of indicated proteins in control and VDAC2-deficient LoVo tumour cells treated with or without IFNγ for 48 h, with densiometric quantification of BIM, BID and BAK shown. The same VDAC2 and β-ACTIN blots were shown in Fig. 3s. g, Control, VDAC2-deficient, STAT1-deficient, VDAC2 and STAT1 co-deficient, IRF1-deficient or VDAC2 and IRF1 co-deficient (B16-OVA tumour cell survival after treatment with or without IFNγ (10 ng ml–1) for 24 h (n = 3 per group). h, Relative Ifnb1 and Ccl5 levels (versus non-treated control cells) indicated B16-OVA tumour cells treated with or without IFNγ (10 ng ml–1) for 24 h (n = 3 per group). i, Immunoblot analysis of BIM, BID and VDAC2 in control, VDAC2-deficient, BIM-deficient, BID-deficient, BIM and BID co-deficient, VDAC2 and BIM co-deficient, VDAC2 and BID co-deficient, or VDAC2, BIM, and BID co-deficient tumour cells (left). Cell death of indicated B16-OVA tumour cells treated with IFNγ (10 ng ml–1) for 24 h (right; n = 3 per group). j, Control, VDAC2-deficient, BIM and BID co-deficient, or VDAC2, BIM and BID co-deficient B16-OVA cell viability after co-culture with OT-I cells at the indicated E:T ratios for 36 h (n = 3 per group). k, Indicated B16-OVA cells were treated with IFNγ for 24 h. Mitochondrial fractions were isolated and treated with 1,6-bis-maleimidohexane (BMH). Samples were separated by SDS-PAGE to resolve different BAK complexes (monomers, dimers, and trimers as indicated). Densiometric quantification of BAK trimers is shown. l, Expression of cytochrome c (Cyto c) and SMAC in cytosolic and mitochondrial fractions of indicated B16-OVA tumour cells treated with IFNγ for 24 h. m, Relative cytosolic mtDNA levels (versus non-treated control cells) in indicated B16-OVA tumour cells treated with or without IFNγ for 24 h (n = 3 per group). n, Immunoblot analysis of indicated proteins in B16-OVA tumour cells treated with or without IFNγ. Densiometric quantification of p-STING, p-TBK1 or p-IRF3 is shown. o, Relative Ifnb1 and Ccl5 levels (versus non-treated control cells) expression in indicated B16-OVA tumour cells treated with IFNγ for 24 h (n = 3 per group). p, Relative expression of genes (with differential expression (|log2FC | > 0.5, P value < 0.05) in VDAC2-deficient versus control tumour cells in indicated B16-OVA tumour cells after treatment with IFNγ for 24 h (n = 3 per group). Data are representative of two (b–o) independent experiments and are presented mean ± s.e.m. One-way ANOVA (g, h; right panel for i; j, m, o). Two-way ANOVA (e).

