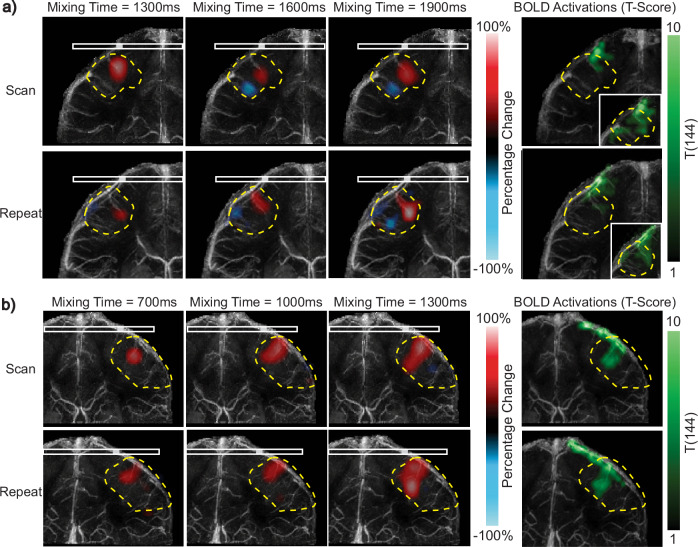
Fig. 7. Repeatability analysis for neural activation experiments of Subjects 1 and 2.
a Left: Percentage change in perfusion source maps at three mixing times for the vein draining the right motor cortex of Subject 1. Results are displayed for the initial and repeat scans. Right: Blood Oxygenation Level Dependent (BOLD) T-scores (green), from one-sided T-test, of the coronal section containing the vein. To visualize functionally activated regions in more detail, the BOLD T-scores are shown with a higher significance threshold on the right corner. b Left: Percentage change in perfusion source maps at three mixing times for the vein draining the left motor cortex of Subject 2. Right: BOLD T-scores (green), from one-sided T-test, of the coronal section containing the vein. The initial and repeat scans show good overlap for both subjects in regions that exhibit positive and negative percentage change. Note that the scans were performed on different sessions, leading to some differences in head orientation and imaging slice position. Venous territories are marked with yellow dashed contours. Source data are provided in ref. 54.

