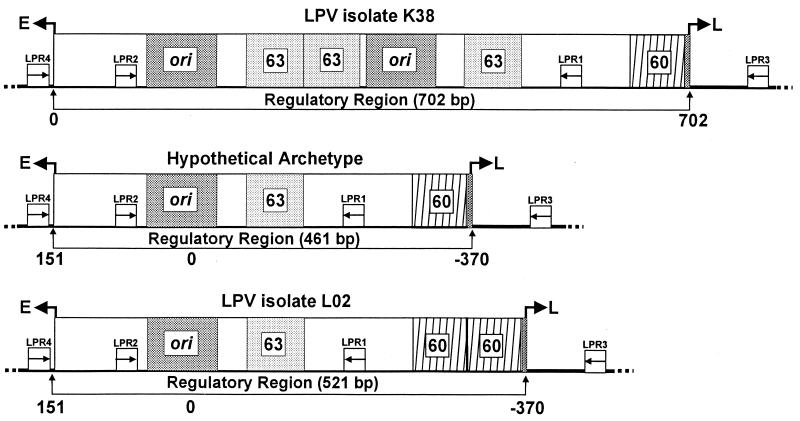
FIG. 1.
Schematic representation of representative LPV regulatory regions. Structures for LPV isolate K38, isolate L02, and the hypothetical archetype are from Pawlita et al. (11), Furuno et al. (4), and Yoshiike and Takemoto (17). The numbers below the diagrams refer to nucleotide positions within the regulatory region and are from the references cited. The LPV PCR primer binding sites are represented by small boxes inscribed with arrows; arrows indicate the direction of DNA synthesis initiated from those positions. A box inscribed ori represents the origin of DNA replication. Sequences to the right of ori that are within the delimited regulatory region (indicated below each figure) are considered enhancer sequences. The enhancer 63- and 60-bp subgenomic elements are shown as boxes inscribed with the no. 63 or 60. Arrows pointing to the left or right at the borders of each diagram refer to the direction of late (L) or early (E) viral transcription.

