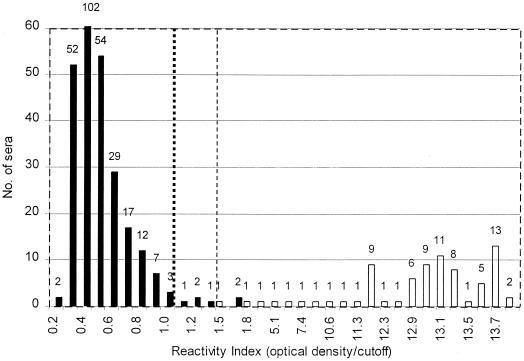
FIG. 1.
Histogram indicating distribution of positive (open bars) and negative (solid bars) sera relative to the RI. The total number of sera with a given RI is indicated above each column. The dotted line indicates the cutoff preset by the manufacturer, and the dashed line indicates the cutoff suggested by the authors. For better visualization of the bars representing only one serum, the ordinate was truncated at a value of 60.

