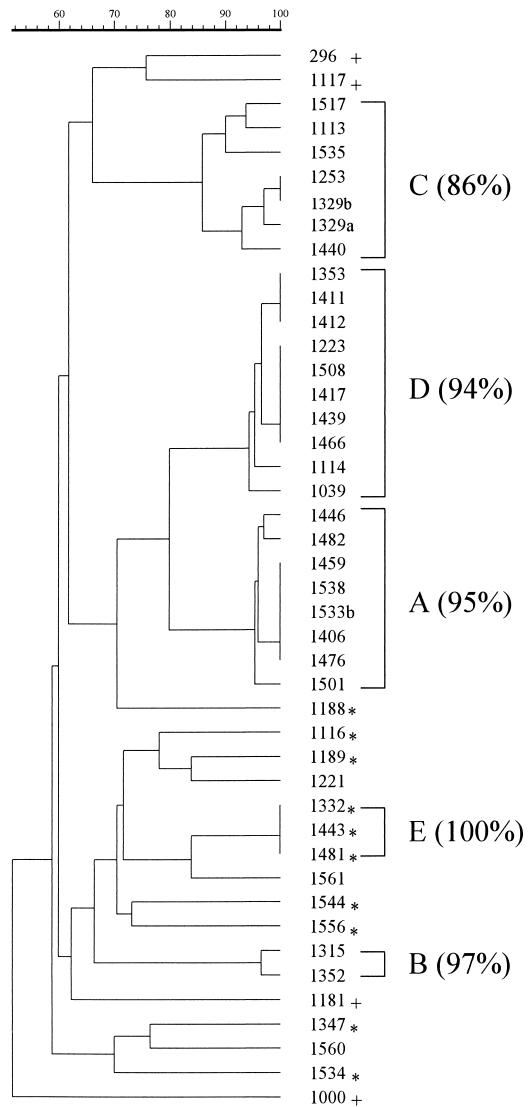
FIG. 1.
Dendrogram of isolate similarity based on PFGE patterns. Clusters of isolates displaying at least 85% similarity are indicated by brackets, with the similarity index in parentheses. The similarity scale is shown above the dendrogram. Asterisks indicate EPKP isolates from hospital wards other than the NICU; plus signs indicate non-EPKP control isolates.

