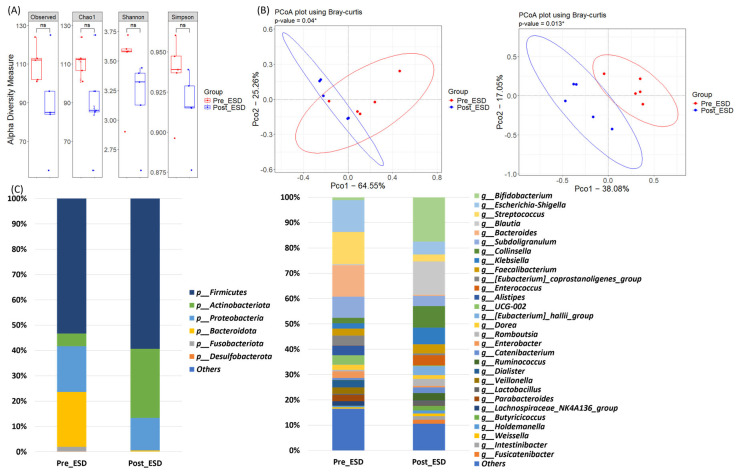
Figure 3.
Comparison of alpha diversity, beta diversity, and relative abundance between pre- and post-treatment in ESD group. (A) Alpha diversity measures, including Observed, Chao1, Shannon, and Simpson indices, were compared between pre- and post-treatment in ESD group. (B) Principal Coordinate Analysis (PCoA) using Bray-Curtis dissimilarity was performed to examine the beta diversity of the microbiomes at both phylum and genus levels. (C) Bar graphs illustrating the microbiome composition at the phylum and genus levels in both groups, showing the relative abundance of major bacterial taxa present before treatment. * p < 0.05, ns: p ≥ 0.05.

