Fig. 5.
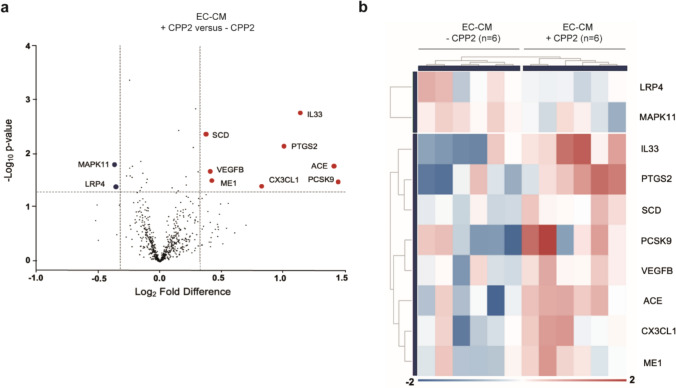
VSMCs exposed to CPP2-activated ECs conditioned medium display differential gene expression patterns. a Volcano plot of NanoString nCounter gene expression analysis data indicating significantly upregulated (red dots) and downregulated (blue dots) genes in VSMCs that were cultured in conditioned medium from HUVECs exposed to 25 µg/ml CPP2 (“EC-CM + CPP2”) vs. VSMCs cultured in conditioned medium from HUVECs not exposed to CPP2 (“EC-CM – CPP2”) (fold change ≤ – 1.25 or ≥ 1.25 and P < 0.05), b Heatmap displaying clustering of the “EC-CM -CPP2” and “EC-CM + CPP2” conditioned medium exposed VSMC samples based on the significantly differentially expressed genes

