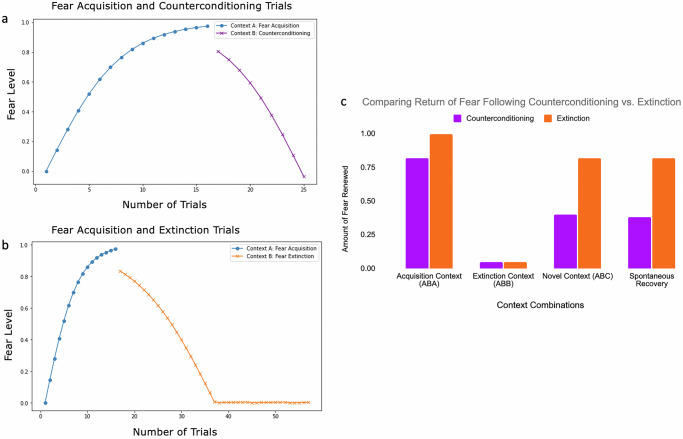
Fig. 5. Counterconditioning.
a Model predictions of levels of fear during Fear acquisition (in blue) and counterconditioning (in purple) across experimental trials. b Model predictions of levels of fear during Fear acquisition (in blue) and extinction (in orange) across experimental trials. c A comparison of the amount of fear that returns following counterconditioning (purple bars) and extinction (orange bars). The first 3 sets of bars represent the immediate return of fear via fear renewal in the acquisition, extinction, and novel contexts, respectively. The final pair of bars represents the return of fear in the extinction context after a 21-day delay via spontaneous recovery.

