
Fig. 3.
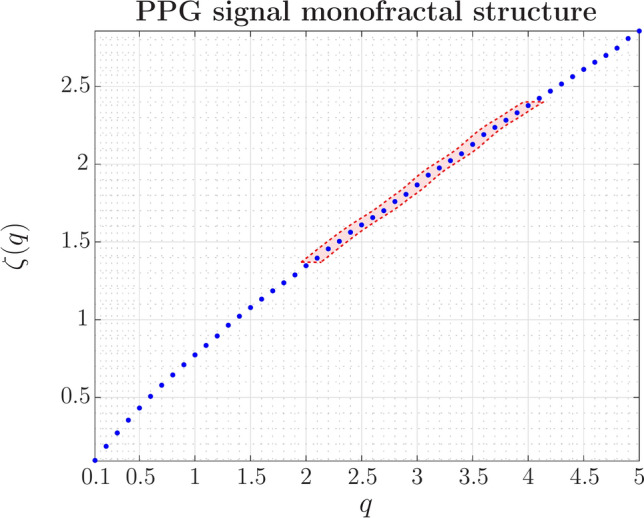
In relaxation conditions (basal level),  is nearly linear for moments greater than 1, a signature of a monofractal process. The exponent,
  , is calculated for a range of q values identifying the moment of the statistic, which, in this case, refers to the temporal structure function. Each data point derives from Eq. 3, where the value of
  represents the average scaling exponent of
  in Eq. 1, across the 40 subjects. A slight oscillatory modulation is seen for
  (highlighted in light red). With a more in-depth investigation, periodic modulation could unveil a phase transition in anomalous diffusion processes.