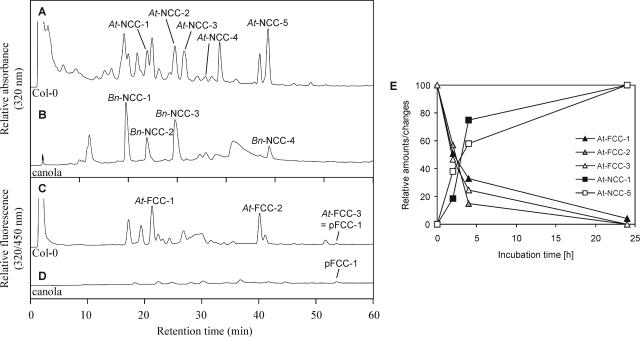
Figure 2.
HPLC analysis of chl catabolites in Arabidopsis and canola. Chl catabolites of senescent Arabidopsis (A and C) and canola (B and D) leaves were separated by HPLC as described in “Materials and Methods.” A320 (A and B) and fluorescence (C and D) were recorded. For the identification and characterization of FCCs and NCCs, see Table I. E, Conversion of FCCs to NCCs during incubation of Arabidopsis leaf extracts at pH 5. Formation of NCCs (squares: black, At-NCC-1; white, At-NCC-5) is expressed as difference in peak area at 320 nm relative to the peak area at 0 h (24-h sample set to 100). Decrease in FCCs (triangles: black, At-FCC-1; gray, At-FCC-2; white, At-FCC-3) is expressed as relative difference in fluorescence (320/450 nm; 0-h sample set to 100).

