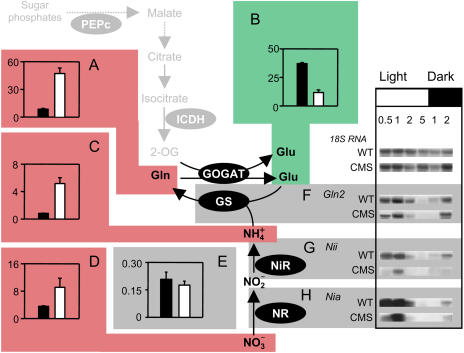
Figure 4.
Accumulation of nitrogen-rich metabolites in CMS is not accompanied by enhanced expression of enzymes involved in primary nitrogen assimilation. Black bars, wild type; white bars, CMS. Color coding as for Figure 3. A, Gln. B, Glu. C, Ammonia. D, Nitrate. E, Maximal extractable NR activity. F, RNA gel blots of Gln2 transcripts encoding GS2. G, RNA gel blots of Nii transcripts encoding NiR. H, RNA gel blots of Nia transcripts encoding NR. Symbols and sampling as in Figure 3. Gln and Glu are expressed as percent of total amino acids. Nitrate and ammonia are expressed in μmol mg−1 chlorophyll. In panels F to H, the numbers indicate duration in hours into the light (white bar) or dark (black bar) period.

