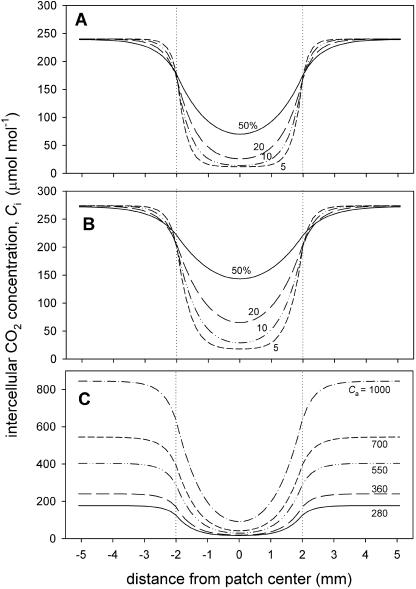
Figure 10.
Transects of intercellular CO2 concentration, Ci, across a 4-mm-diameter patch (limits indicated by dotted vertical lines) calculated from the diffusion model. A and B show results for different reduction factor values, φ, for the CO2 diffusion coefficient Dc at fixed Ca (360 μmol mol−1) and either high (A) or low (B) net CO2 assimilation capacities (as indicated by the rate outside the patch of 23.5 and 12.1 μmol m−2 s−1, respectively). Numbers indicate φ in percentages. Model parameters were as follows: A, gsc = 200 mmol m−2 s−1, leaf thickness = 400 μm, a = 45 μmol m−2 s−1, b = 160 μmol mol−1, c = 3.0 μmol m−2 s−1; and B, gsc = 140 mmol m−2 s−1, a = 20 μmol m−2 s−1, b = 90 μmol mol−1, c = 3.0 μmol m−2 s−1 (see “Materials and Methods”). C shows Ci values for different Ca, using parameters from the high A case in A, with φ = 15%; Ca values are indicated.

