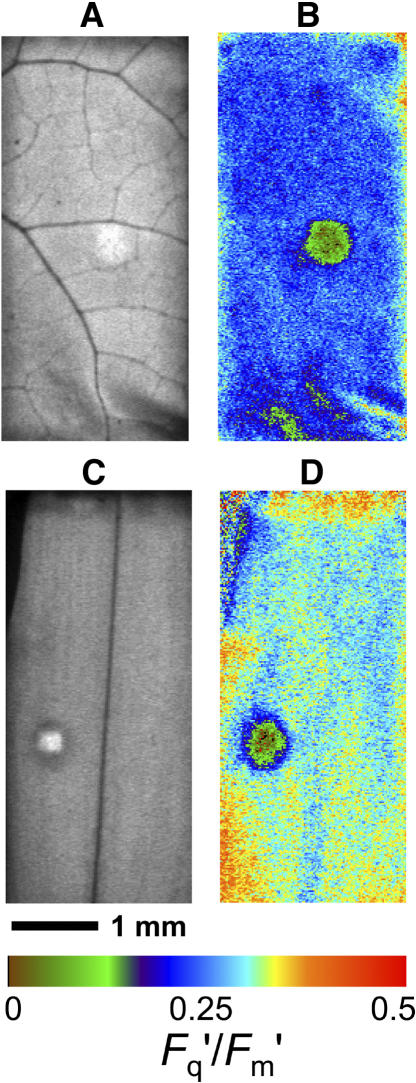
Figure 2.
Images of chlorophyll fluorescence for 10-cm2 leaf areas enclosed in a chamber (4.6×2.2 mm) during simultaneous gas exchange measurement. A and B are for P. vulgaris, and C and D are for C. communis leaves with a single 4-mm-diameter grease patch applied to both leaf surfaces. PPFD = 400 μmol m−2 s−1; leaf temperature = 25°C; 1% O2; CO2 = approximately 320 μmol mol−1. Images A and C are for F′ (arbitrary gray scale). Images in B and D are for Fq′/Fm′, with the colored bar indicating how the range of values is mapped to the color palette; mean values are 0.239 and 0.300, respectively.

