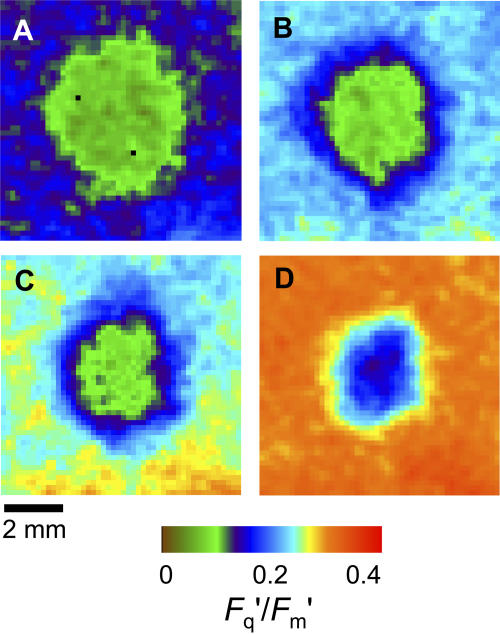
Figure 4.
Images of PSII efficiency (Fq′/Fm′) in part of a leaf of P. vulgaris (approximately 8 × 8 mm) with a 4-mm-diameter grease patch applied to both sides at different external CO2 concentrations (Ca). PPFD was 400 μmol m−2 s−1. Ca and intercellular CO2 concentration, Ci, values determined for the unpatched portion of the leaf were as follows: A, Ca = 97, Ci = 57; B, Ca = 270, Ci = 166; C, Ca = 360, Ci = 227; and D, Ca = 1,780, Ci = 1,270 μmol mol−1. The colored bar indicates how the range of Fq′/Fm′ values is mapped to the color palette.

