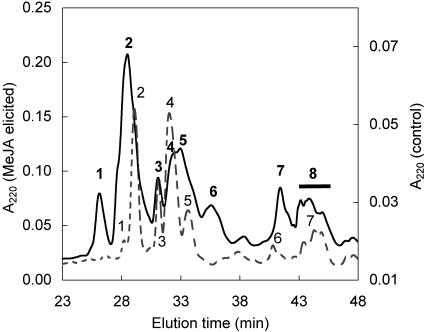
Figure 2.
RP-HPLC separation of TPIs from N. attenuata of the wild-type genotype. Numbers refer to TPI fractions containing inhibitory activity against trypsin. RP-HPLC profile of TPIs from uninduced control leaves (dashed line, right y axis) and leaves elicited by MeJA (solid line, left y axis) are compared. Both samples were prepared from the same amount of leaf tissue. Note the scaling differences between the two y axes reflecting the different TPI levels in the constitutive and elicited material. The chromatography was performed on a C4 Vydac column equilibrated in 0.1% (v/v) trifluoroacetic acid (TFA), eluted with a 0.5%/min gradient of 60% (v/v) acetonitrile, and monitored by A220.

