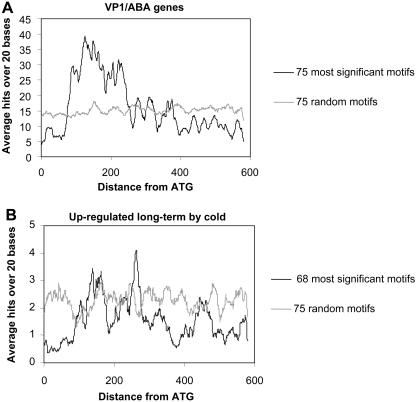
Figure 4.
Biased distribution of enriched motifs in the promoters of VP1/ABA and cold long-term up-regulated genes. A, The distribution of the 75 most significant motifs in promoters (600 bp upstream of ATG) of 353 VP1/ABA-regulated genes (black line) compared to 75 random motifs (gray line). B, The distribution of the 68 most significant motifs in promoters of 58 ColdUp genes (black line) compared to 75 random motifs (gray line). The plots show the average number of significant bases in a 20-bp sliding window.

