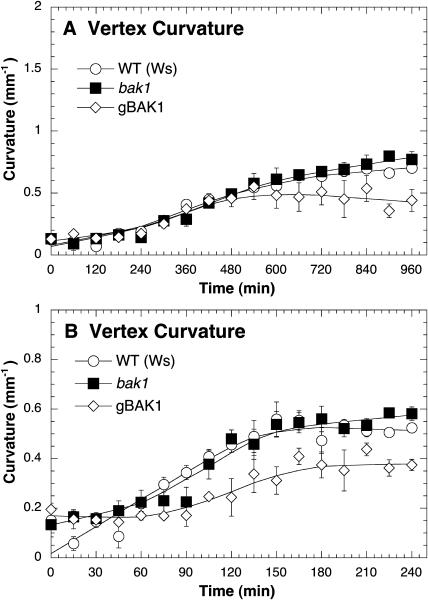
Figure 6.
The phototropic responses of bak1-1 mutants and BAK1 overexpressing plants (gBAK1). A, Phototropic responses to high-fluence rates of unilateral blue light (100 μmol m−2 s−1). B, Phototropic responses to very-low-fluence rates of unilateral blue light (0.01 μmol m−2 s−1). Vertex curvature (mm−1) was used to measure the magnitude of phototropism. Error bars represent se.

